Hi, does anyone know how to use this new chart type? I couldn’t find any documentation or threads in the forum.
ERPNext: v12.2.2
Frappe Framework: v12.0.20
Hi, does anyone know how to use this new chart type? I couldn’t find any documentation or threads in the forum.
ERPNext: v12.2.2
Frappe Framework: v12.0.20
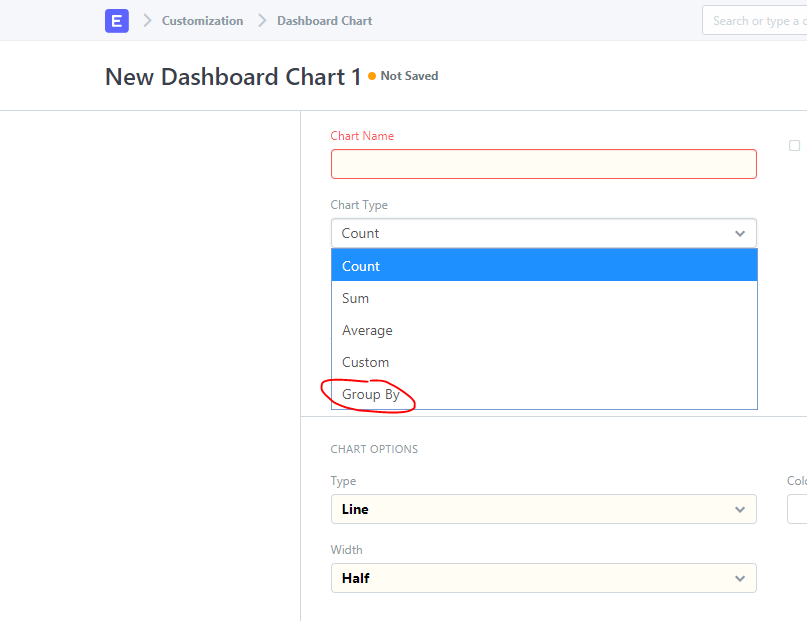
The Group By Dashboard Chart Type can be used to create a chart grouped according to a selected field.
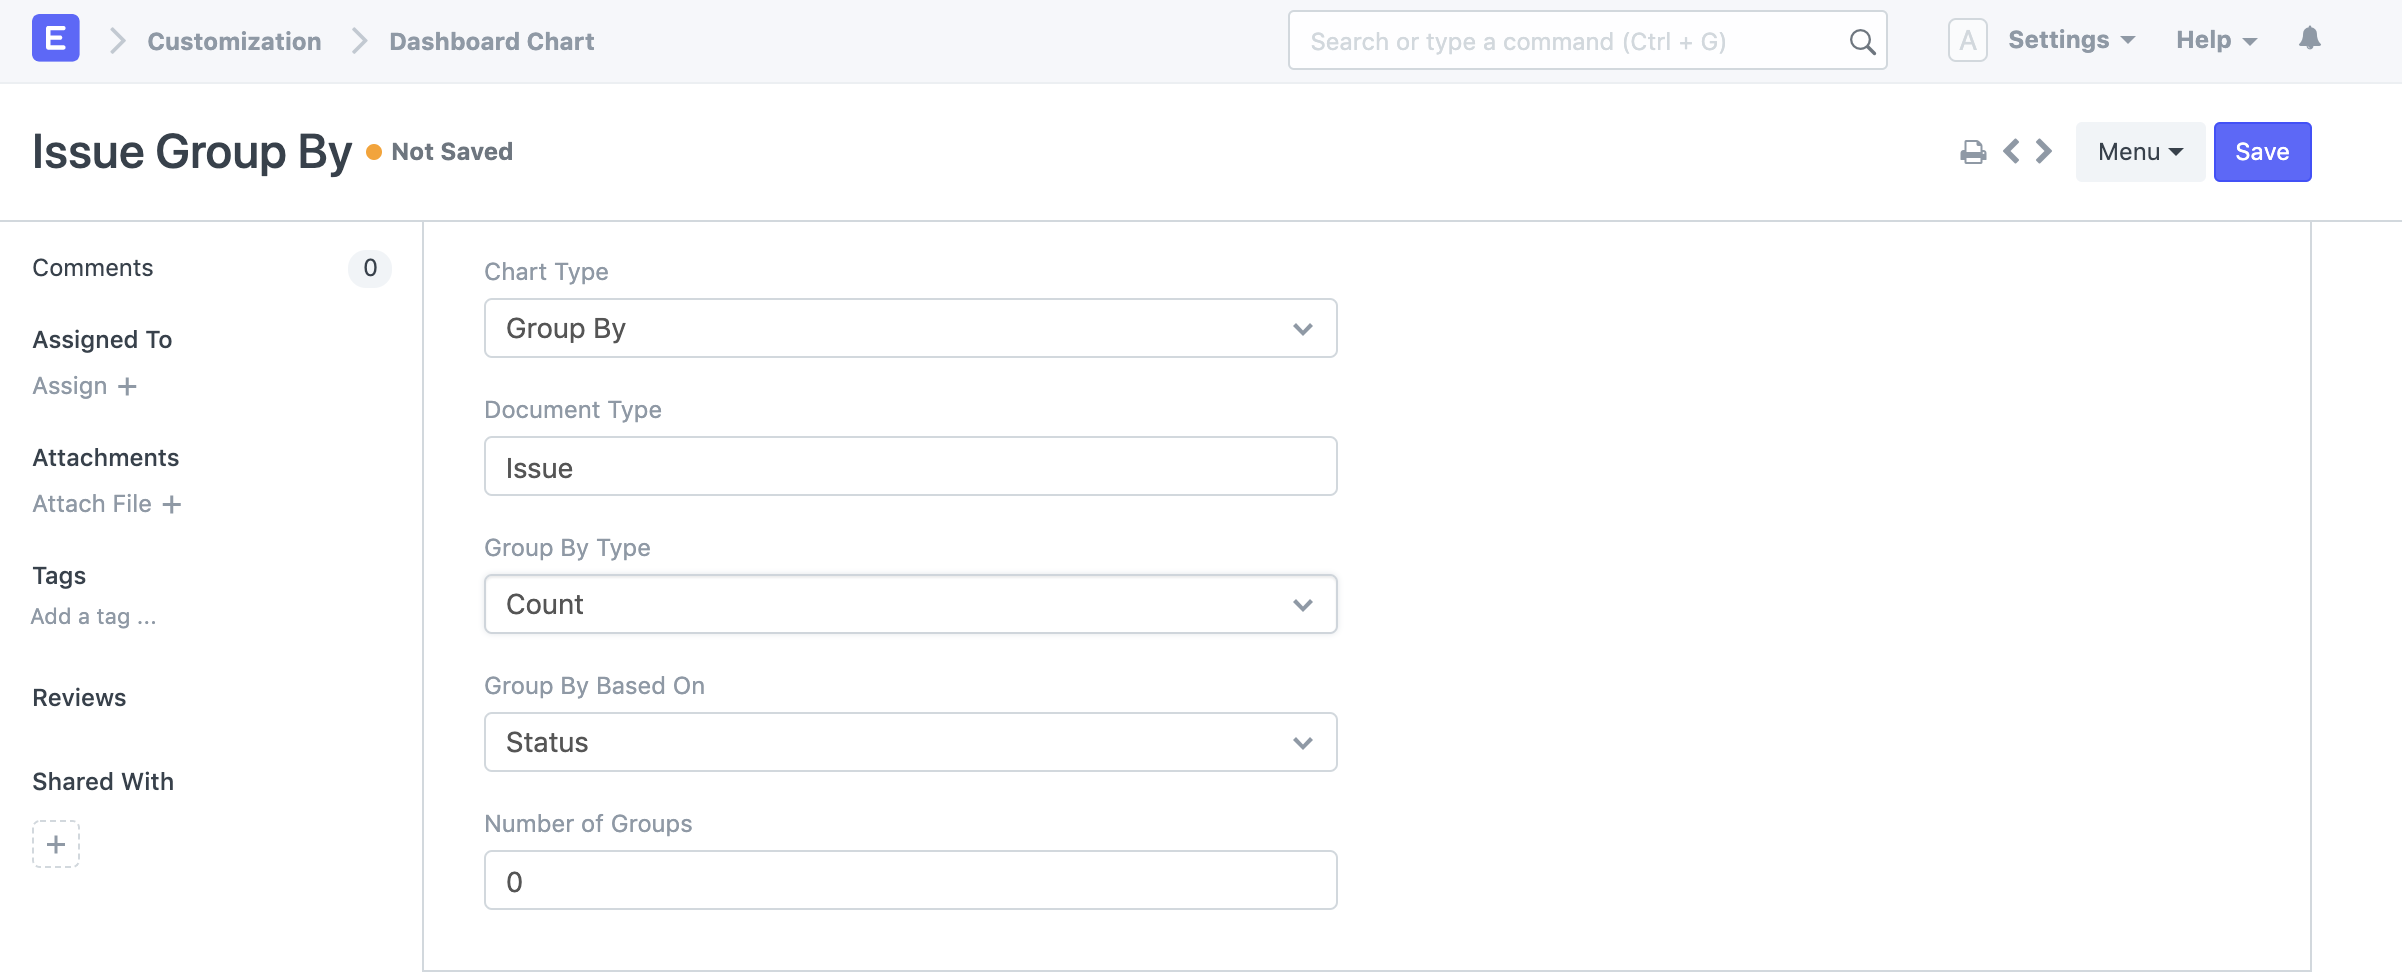
For example, to create a chart which contains a representation of the count of Issues per Status value, this is how the config would look:
The Group By Based On field is the field by which the chart should be grouped and the Group By Type field is the function that will be used to group the values (it can be Count, Sum or Average).
The Number of Groups field is used to select the number of groups you would like to see in the chart. If it is smaller than the actual number of groups, the remaining values will be grouped together into a single group called Other (0 is the default value in which case it will depict the actual number of groups).
This is how the resulting chart would look:
Hope that helps!
Hi! Is it possible to pick a custom field in the “group by based on” input? How does the custom field have to be configured in order to show up there? Thanks
Hi! I have the same question; the “Group by Based On” list only shows related DocTypes, and when the chart it’s rendered, the group field is the ID of those DocTypes, instead of a description (in my case).
@JPKoder, were you able to make it work?