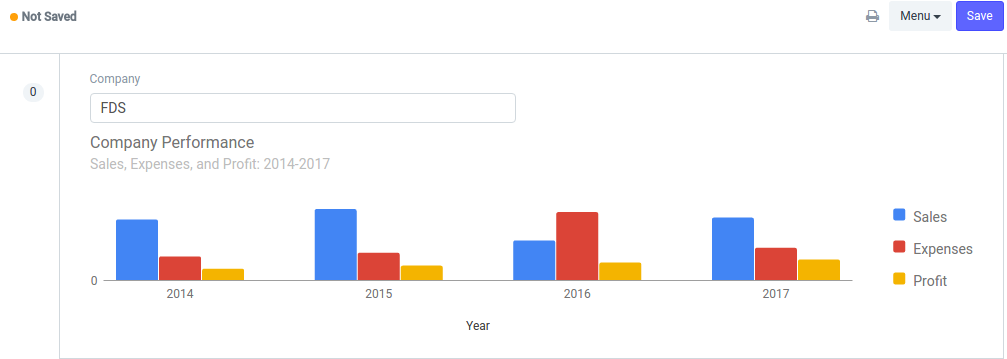
I defined HTML docfield in doctype and name it “chart” then create chart by google chart library and render it in custom script:
frappe.ui.form.on(“ali”, {
refresh: function(frm) {$.getScript(“https://www.gstatic.com/charts/loader.js”, function(){
google.charts.load(‘current’, {‘packages’:[‘bar’]});
google.charts.setOnLoadCallback(drawChart);
function drawChart() {
var data = google.visualization.arrayToDataTable([
[‘Year’, ‘Sales’, ‘Expenses’, ‘Profit’],
[‘2014’, 1000, 400, 200],
[‘2015’, 1170, 460, 250],
[‘2016’, 660, 1120, 300],
[‘2017’, 1030, 540, 350]
]);
    var options = {
      chart: {
        title: 'Company Performance',
        subtitle: 'Sales, Expenses, and Profit: 2014-2017',
      }
    };

   var chart = new google.charts.Bar($('[title=chart]')[0]);
chart.draw(data, options);
}});
}
});
it will be like this:
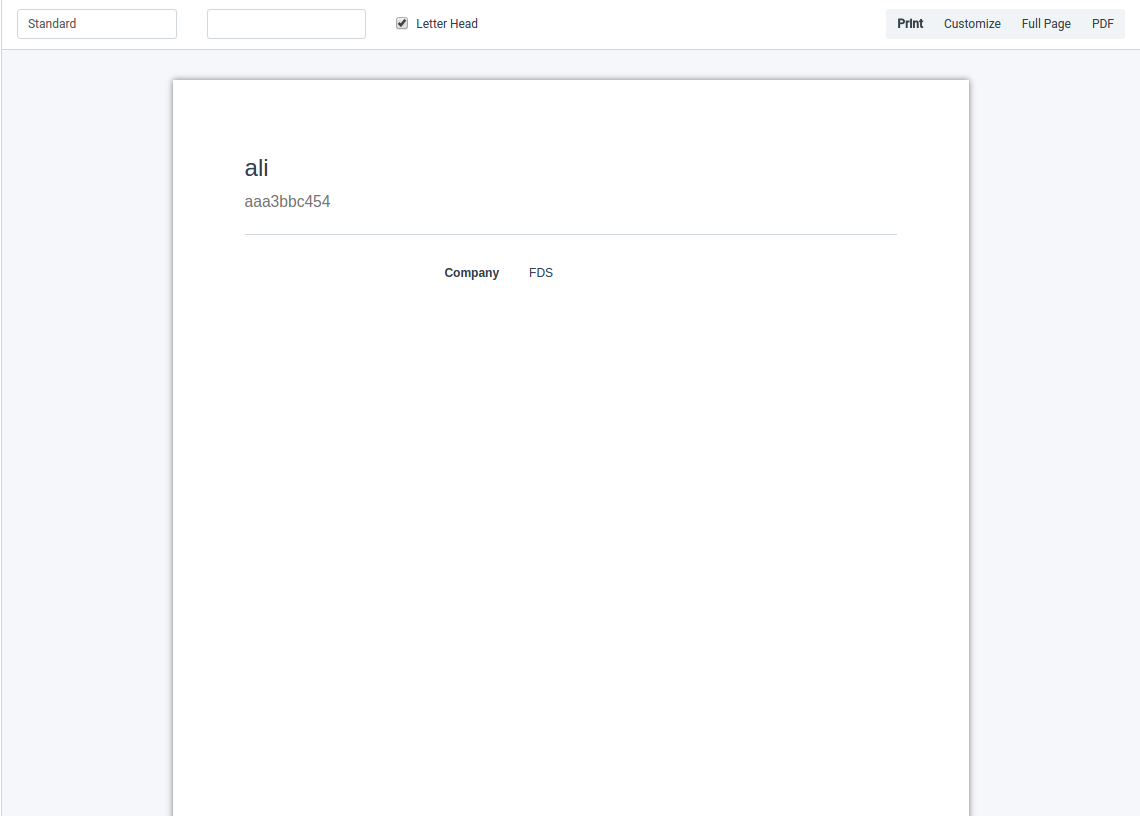
but chart not in print view:
if I press control + P it will appear:
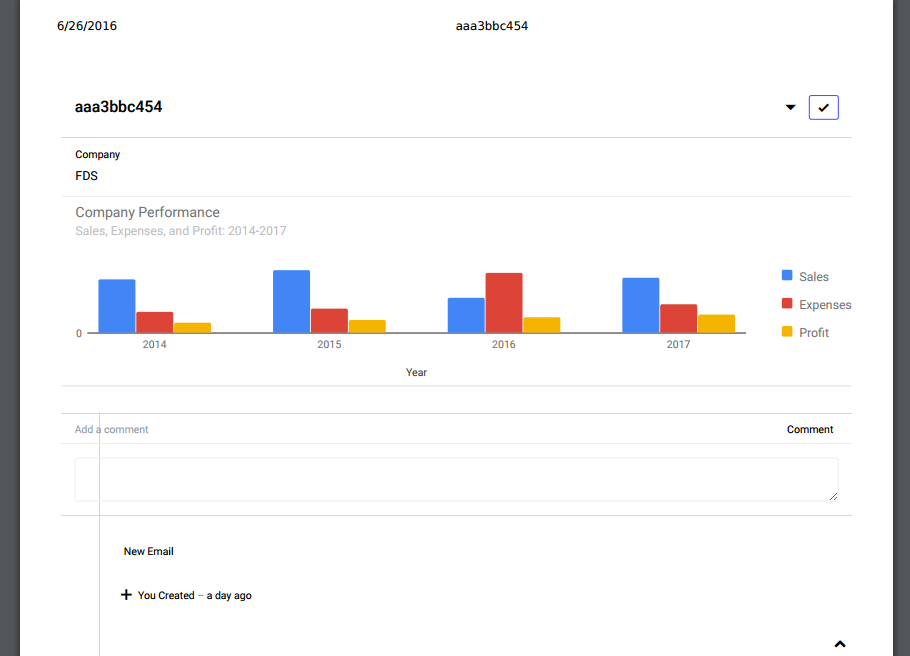
Could you advice me How I can print chart in frappe framework?