Hello all,
I managed to make my report with graphs (very happy ![]() )
)
Now I am wondering how I can set up a minimum value on the y-axis. The idea is to highlight better the differences between each term (it can’t be seen on the pictures because the scale is too big).
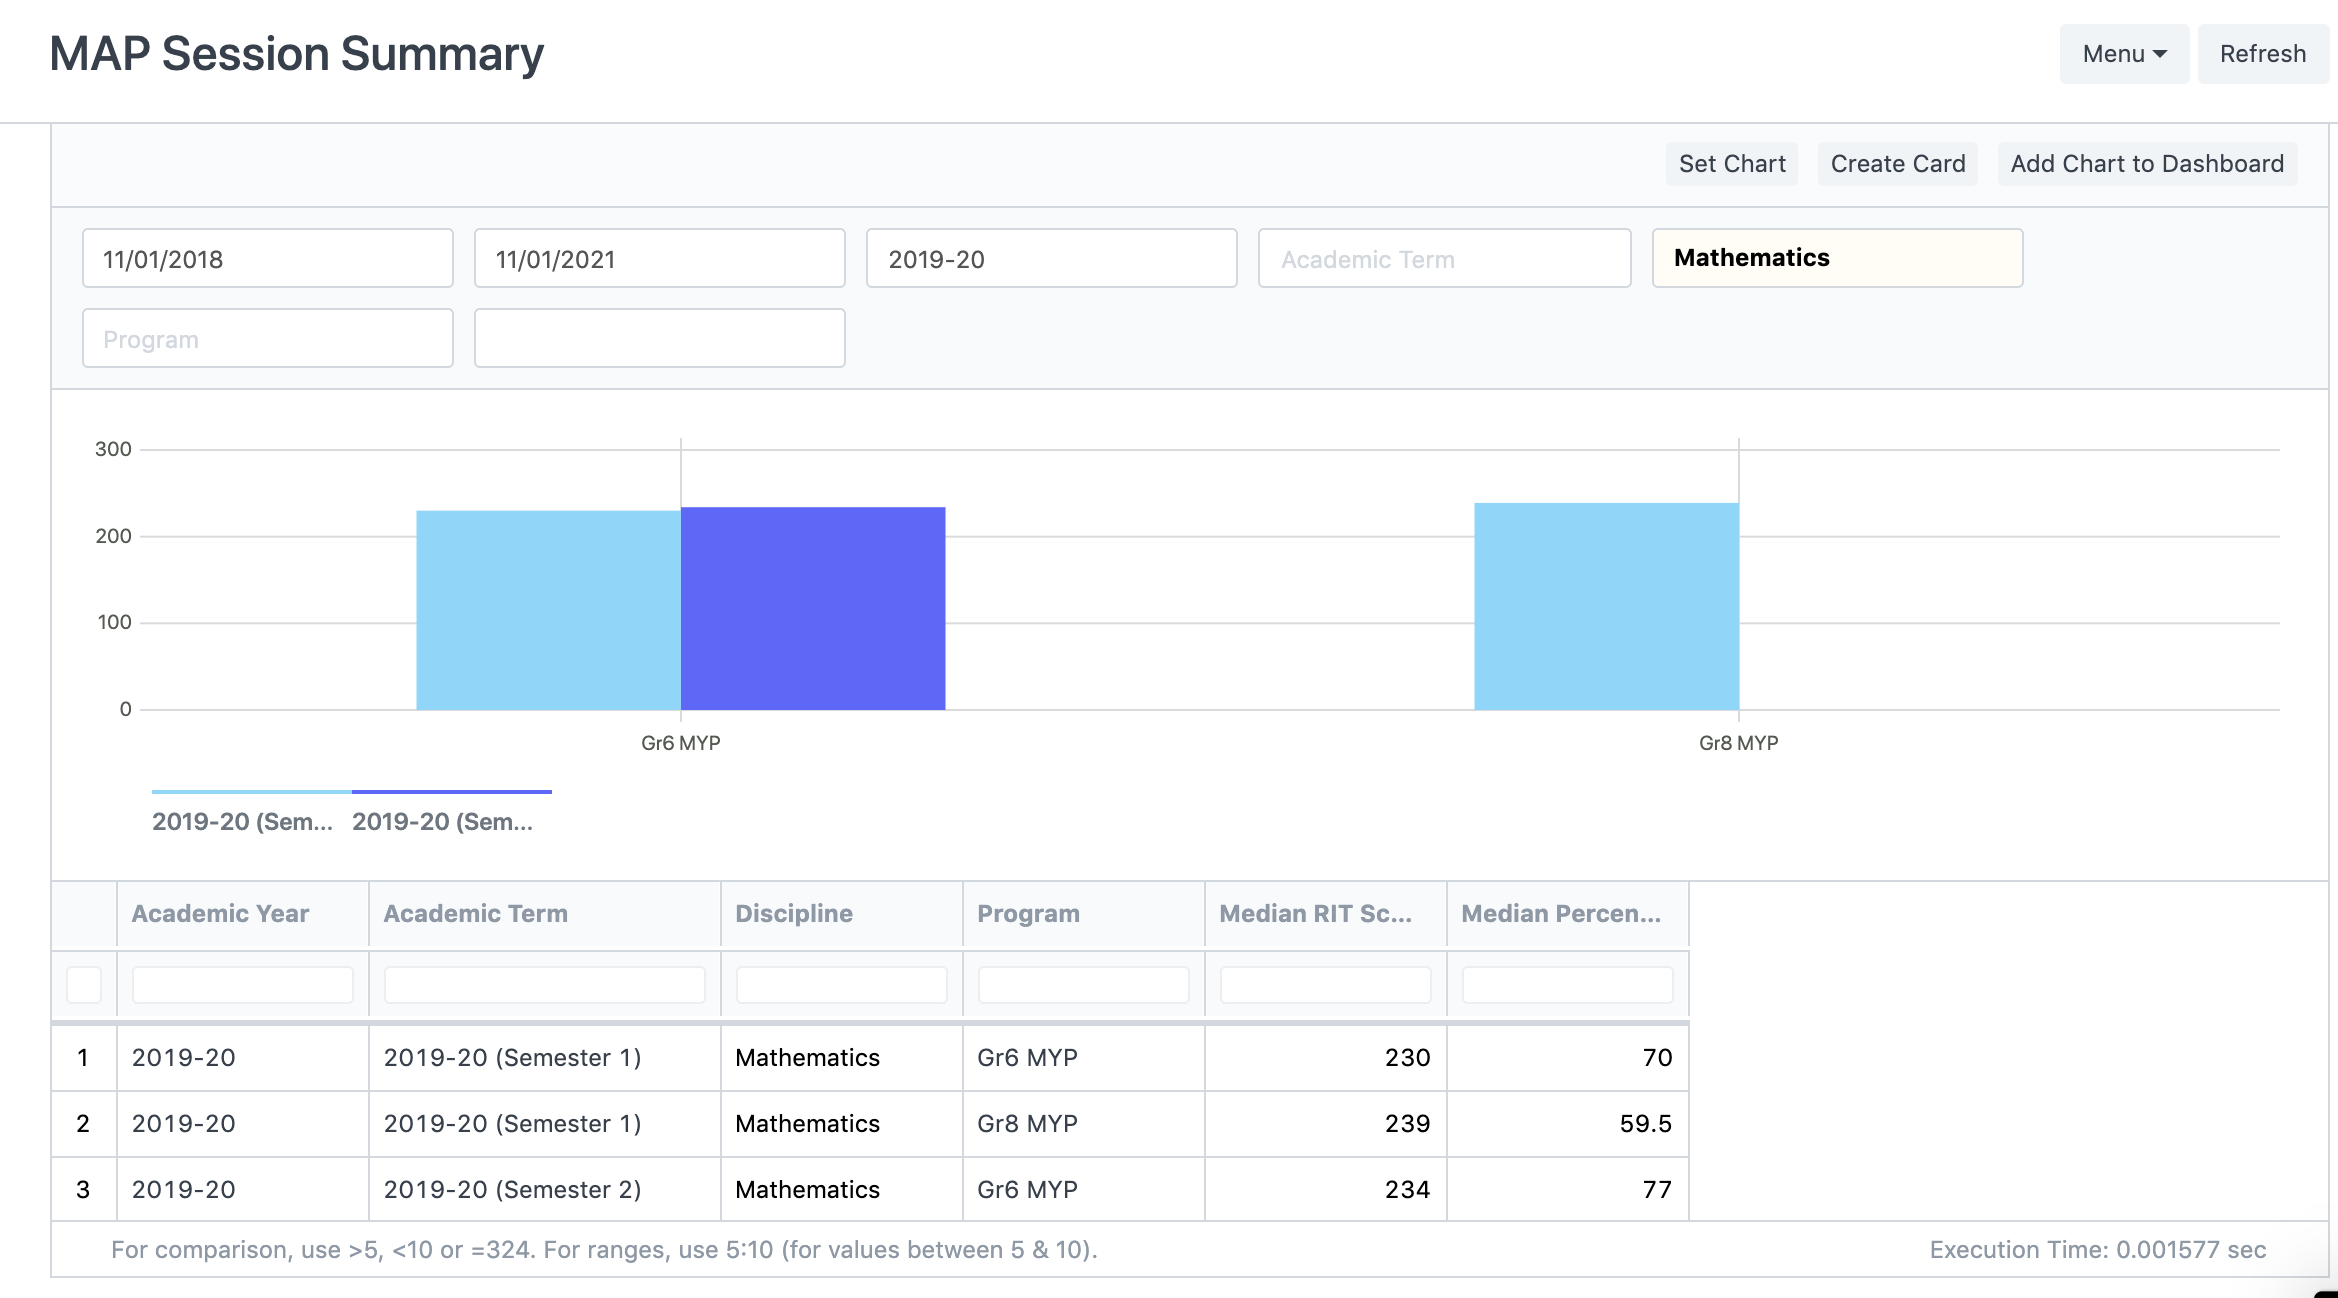
You can see what I have done using “axis”: {“y”: …} , but it doesn’t work. Any idea on how to change it?
  def get_chart_data(data):
	if not data:
		return None

	labels =  []
	datasets = []
	terms=[]

	for entry in data:
		if entry.get("program") not in labels:
			labels.append(entry.get("program"))
		if entry.get("academic_term") not in terms:
			terms.append(entry.get("academic_term"))

	return {
		"data": {"labels": labels, "datasets": datasets},
		"type": "bar",
		"height": 300,
		"axis": {"y": {"min": 150}}
	}
Thanks in advance for any tips/help.
François