Hello;
How I can determine the color of the graph in case of using multiple graphs in the same chart? Below is an example, I do not need the color to be the degrees of the blue color, I need to use blue and red and orange for each graph, from where I can determine this in the code?
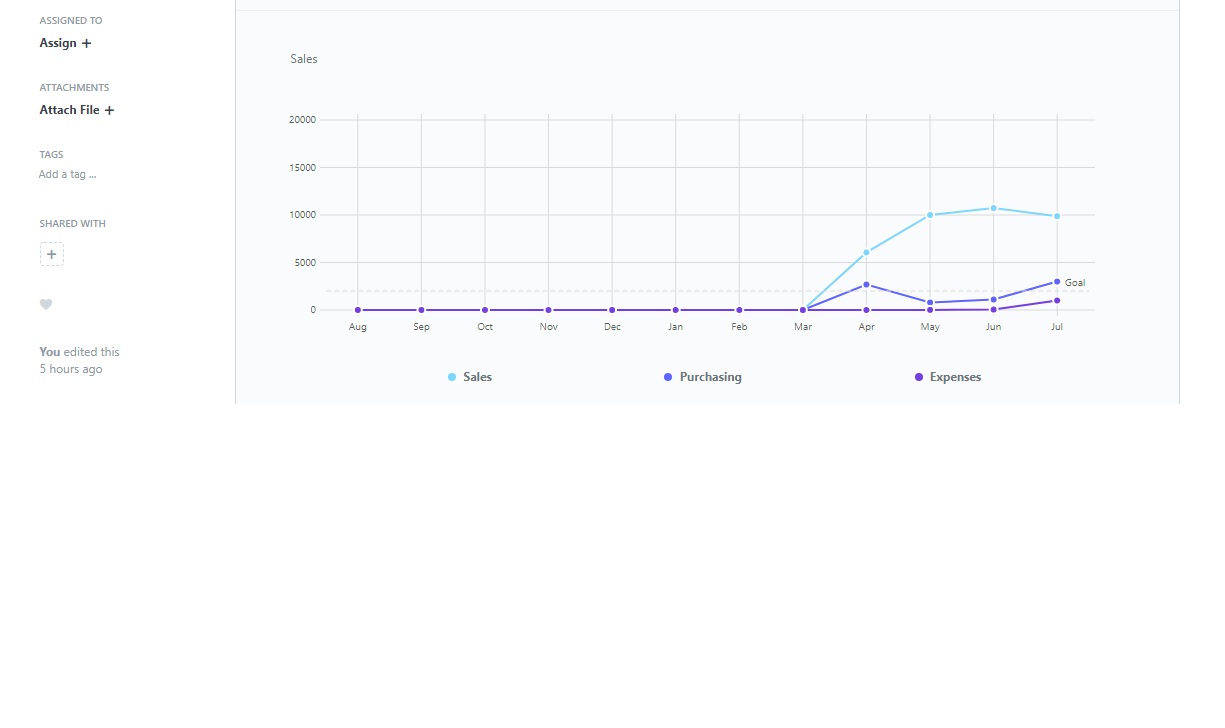
This graph is displayed at the company and it is using the python code method: get_monthly_goal_graph_data which is existed in the frappe/utils/goal.py file.
I tried to set the color in the datasets (as it is the only place that I can set the color for each dataset), but it did not work. So, where it can be set?
Anyway, this graph is set True in the company_dashboard.py and from there, the method get_monthly_goal_graph_data is called and its arguments is given.
I need to be able to set the colors. Any help?
Regards
Bilal