How To Color Cell in Any Reports Based on Values Like >10

Hello,
Please me to color any cell in custom report based on values.
help with a complete code will be appreciated.
Doctype name = Daily Sales
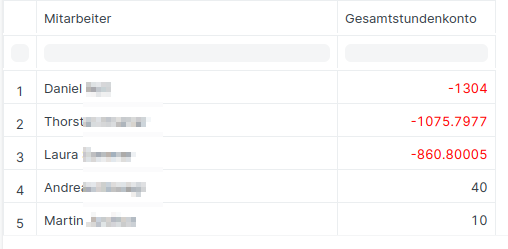
Column / field name = Sales Difference

I want Sales Difference’s color will be red if its values is greater than 10.

Please advise.

I’ve already tried this.

You can share your code so that someone can help.

"formatter":function (row, cell, value, columnDef, dataContext, default_formatter) {
	value = default_formatter(row, cell, value, columnDef, dataContext);
	if (dataContext.name > 0) {
		var $value = $value + $(value).css("background-color", "#75ff3a");
		value = $value.wrap("<p></p>").parent().html();
	}
	return value;
}
});

I’ve put this script in custom script and selected report as a doctype

This cannot be updated by custom script. Should be added in the .js file of the report.

Please guide me how to add .js file and where to add?

The docs are your guide https://frappe.io/docs/user/en/guides/reports-and-printing/how-to-make-script-reports.html

and of course the code too

frappe@erpnext:~/frappe-bench$ find apps/erpnext/erpnext/accounts/report -name '*.js'

Sorry I didn’t find enough in above link.
can you please provide me more details?
actually i am new.
i am unable to enable developer mood.
please help & advise.

Just i want to color negative figures to my custom report.
please advise.

@shahid please look at this:

@Mohammed_Redha first, i want to color cells in custom report. above link guiding about query report.
second, please guide me where to put that script? in excising files or in new file? and also tell me location.
your complete help will be appreciated.
My Scenario :
Doctype Name > Daily Sales Reconciliation
Module > Contacts

Please advise with keeping remember my scenario.
Thanks.

Is there nobody to help me?

Why not show some initiative and help yourself?

Learning is discovery - and there’s a wealth of that here if you are inclined!

1 Like

@shahid maybe this will help you:

https://frappe.io/docs/user/en/guides/reports-and-printing/print-format-for-reports

To wrap it up, if you want to achieve something like this:
grafik

The report is a script report called my_report.
The 2nd column is “gesamtstundenkonto”, it’s defined in my_report.py like this:

def execute(filters=None):
	columns = [
		"Mitarbeiter:Data:300", 
		{
			"fieldname": "gesamtstundenkonto",
			"label": "Gesamtstundenkonto",
		},
	]

my_report.js looks like this:

frappe.query_reports["my_report"] = {
	"formatter": function(value, row, column, data, default_formatter) {
		value = default_formatter(value, row, column, data);
		if (column.id == "gesamtstundenkonto" && value < 0) {
			value = "<span style='color:red;'>" + value + "</span>";
		}
		return value;
	},
};

Took me some time to figure it out, even if the posts in this thread were helpful.
I hope this is useful for someone.

2 Likes